
The Google Public Data Explorer – A tool to visualize large public records with few clicks
The large data (bank) providers, e.g. The German Federal Statistical Office (Destatis), the European Commission (eurostat) or the Organization for Economic Cooperation and Development (OECD) now provide the general public with important data on economic or political issues. These data range from the unemployment rate in Germany over the income levels of individual countries to the international macroeconomic development. The fact that the public interest in such data is of great importance is not surprising.From students to journalists to political decision-makers, work with these data! However, it is problematic to compress and visualize the sometimes huge amounts of data for their own purposes, since not everyone has the sometimes necessary statistical knowledge. A tool from Google with the name Google Public Data Explorer helps.
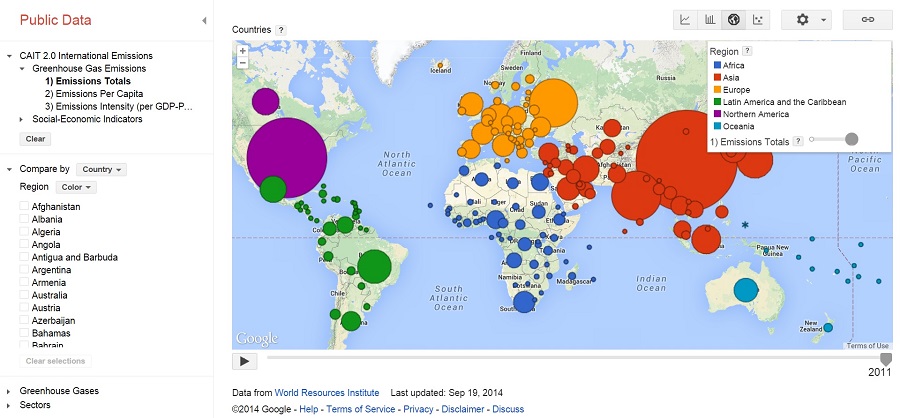
The Google Public Data Explorer allows users not only to search large data sets from public providers, but also offers the possibility to graphically represent certain relationships. The user can also make individual settings or choose between different diagram types.
These graphics can be linked or linked to their own website. Embedded diagrams can be updated automatically so that the results shown are always up-to-date. The Google Public Data Explorer which is one of the Google Project thus provides a convenient solution for the presentation and visualization of public data, especially for those with little or no statistical knowledge.
“Google Public Data Explorer” for more dynamic:
The parade example from Google shows a graphic, which visualizes the comparison of the birth rate and life expectancy in different countries. The big advantage of this is that the year can be changed with a slider. So you can quickly and easily observe the development in recent years.
This new version of Google Public Data Explorer, of Hans Rosling emerges that make it easier to understand the world we live in. Not in vain is it a tool based on Gapminder, the technology that Google acquired years ago, which has long been published improved and increased within Google Project. At this time, Google has been adding more and more data to demonstrate the utility of the Tool and receive proposals from users.
The first is to use a lot of public data mainly on demography and economics to create elaborate graphs that change over time and according to the different regions and countries, so that they can be studied from all possible points of view.
The new test data set is more than 30 databases but the main novelty of this version is that now anyone can add their own information to use the tool as a powerful viewer of the area of knowledge that interests you. In the Google Public Data Explorer FAQ, there is a good explanation of how the invention works, still in the “experimental” phase and a well-crafted presentation of a few screens to understand the idea quickly.
Public data for Google Tool
The data for the dynamic statistics can be obtained from a wide range of freely accessible sources. In addition to American data supporters such as the US Census Bureau or the US Bureau of Labour Statistics, information is also obtained from European sources that have been updated regularly for this Google Public Data Explorer project. These include the World Bank, the OECD and the statistical authority Eurostat. All these data from these institutions are public and can be processed further.


